A Historical Study
by Aqeel Phillips
With just a few weeks left in the regular season, some of us are left without much to root for anymore. HEAT fans remain optimistic in the surprisingly competitive battle for the first seed, and Suns, Mavs, and Grizzlies fans are biting their nails short in hopes that their teams can grab a playoff spot. However, a good percentage of us basketball fans now realize we have little to root for anymore (or if you’re a Sixers fan like me, you realized in about August), and are just waiting to see the final playoff seedings and end-of-season awards before the playoffs get underway. Besides the MVP, one of the most notable awards each year is the Scoring Title. Last season, we were treated with a thrilling ending as the battle for the Scoring Title came down to the wire between Kevin Durant and Carmelo Anthony.
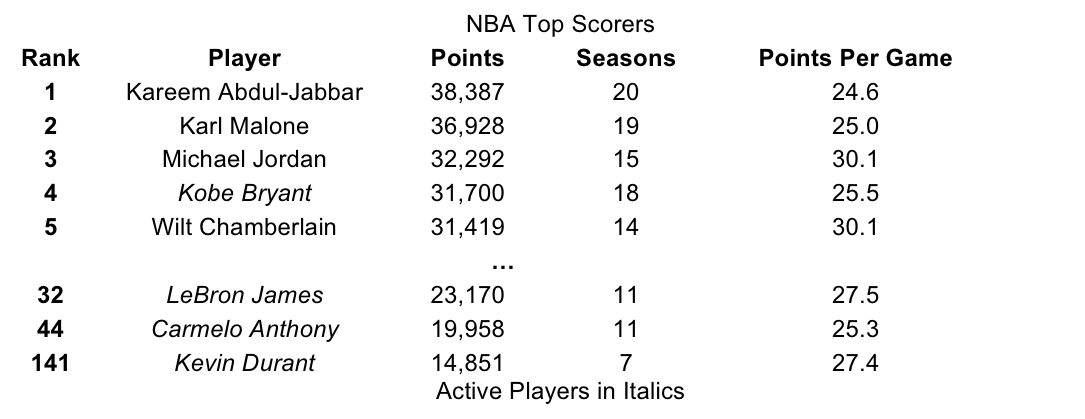
This season, Kevin Durant aka the Slim Reaper has made things less interesting, currently scoring 32.2 points per game (PPG) over 2nd place Melo’s 28.0 PPG. Durant is the only player to average 30 points since he did in the 2009-10 season. The NBA has had a notable drop in scoring lately, a trend first starting when hand checking was instituted in the early 2000’s and extended as many teams have embraced sharing the ball throughout the team in order to better find open looks, namely threes, rather than relying on singular scorers. Durant’s current season widens eyes at first glance — averaging 4 points more than his next closest competitor will do that. But I find that PPG by itself doesn’t tell the full picture. Elgin Baylor averaged over 38 points in 1961-62, but that was over 50 years ago in a completely different league. So who had the most impressive season: 2014 Durant? 1962 Baylor? 2006 Kobe? We’ve witnessed plenty of monstrous seasons, and this study examines them in relation to the rest of the league at the time to contextualize the simple PPG marks.
League Scoring Average (Season)
To get a better comparison between scoring performances, we can divide a player’s PPG by their minutes per game (MPG) marks to see how they’re scoring with regard to the opportunities they’re being given. This is especially useful in calculating a league average scoring mark. We don’t want end bench players that average 0.6 PPG to drag down the entire league scoring average, most importantly because they outnumber the talented, 20+ PPG scorers in the league. Dividing PPG by MPG for each player across the league levels the playing field, and also accounts for the possibility that in any given season the league as a whole significantly played more or less bench/low-scoring players for whatever reason (for example, in the ‘60s there were much fewer players in the league and more minutes and points to go around).
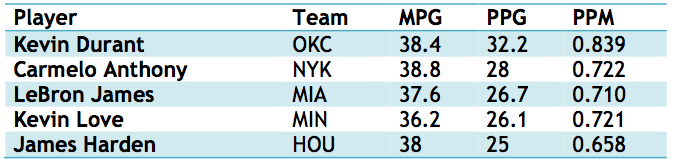
For reference, here are the Points Per Minute values for the current league leaders in scoring:

(For those wondering about a full list of the league leaders in PPM, see the appendix)
In terms of points scored per time played, you can see that Durant is not just scoring at an average rate while playing more minutes, he is scoring more efficiently than the players below him on the list (shown by a higher PPM value than his competitors). It’s interesting to note that Melo averages more minutes than Durant, but Durant makes much better use of his time, scoring-wise, than Melo (Durant is also more efficient with his shot attempts - averaging 20.7 field goal attempts per game to Melo’s 21.5). This gives more evidence to Durant’s case for “best scorer in the league” - not only does he have the sheer output, but he also has the efficiency.
Next, we’ll calculate the average PPM value for the entire league, and compare each individual player to that average, to see how much better they score than the average replacement.
Unlike other studies I’ve done, I haven’t artificially subtracted out all of the players that aren’t contributing much (<20 MPG, <30 GP in previous articles), as using PPM should even out all contributions.
Continue reading “Assessing NBA Scoring Champions Relative to League Average”
Like this:
Like Loading...